Harden your application with Load Tests using Python
Flood your system with requests now so that it doesn’t catch on fire while you sleep.
Whether you like it or not, if you plan to build an API - it will be load tested. The only thing you get to choose is whether you load test it in a controlled environment, or whether you load test your naive and fresh product in the unpredictable arena of production traffic.
I’m not sure about you, but I’ve been paged at 3am enough times to prefer the former.
Who Should Read This?
If you are a builder of applications, particularly APIs, and you want observability into your system’s performance under load. Or if you just want to learn how to build a load generator.
What are we Going to Do?
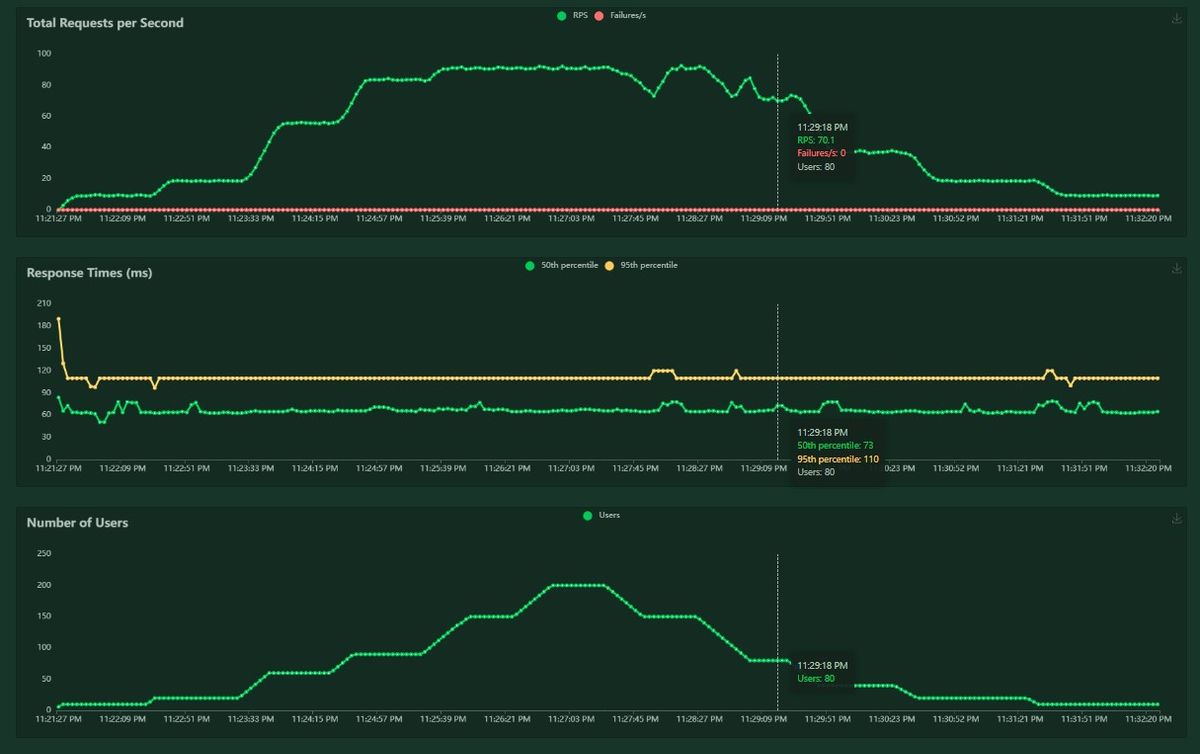
We are going to run some load tests on a simple REST API using locust, which is a framework that allows developers to easily simulate load by executing “tasks” (the unit of work in the locust framework) at a configured load profile. We will end up with some performance metrics for our application that will look something like this:
The (downloadable) metrics provide at least 3 of the 4 golden signals of service monitoring: latency, failures, and throughput (the fourth, saturation, can be extrapolated, but that is a topic for another day).
Setup the API
We aren’t going to complicate things here, just a simple Flask REST API.
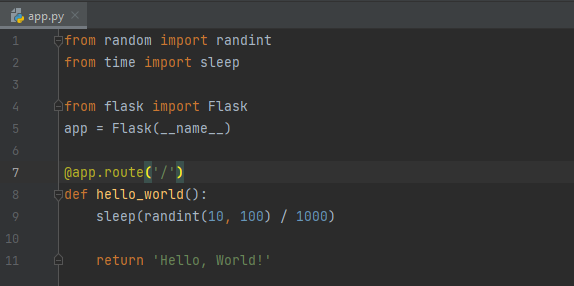
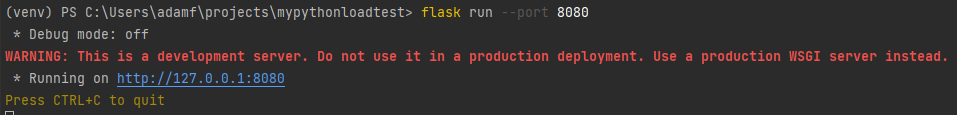
The only non-boiler-plate code is that we take anywhere between 10 and 100 milliseconds to process the request. We can run this Flask server like any other - `flask run -–port 8080`
The Simplest Load Test
Let’s now generate some load on our API - we will start with the simplest possible load test setup:
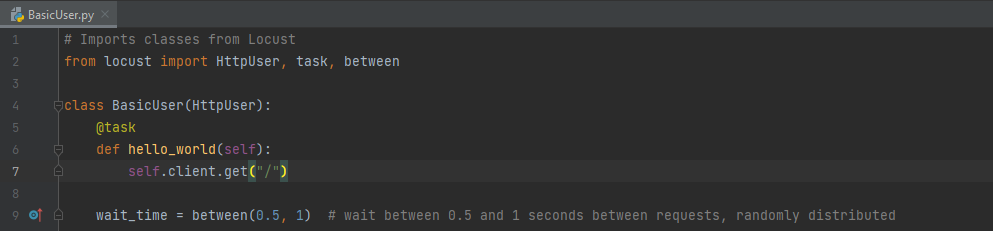
This will call our API at the “/” path (http://localhost/) with a random delay between 0.5 and 1 seconds. The terminology in the locust framework is quite simple to understand - you have users and tasks. “Users” execute “tasks” and are entirely independent. More users results in more tasks.
Lets run this via the command line so we can explore some of the basic configurations
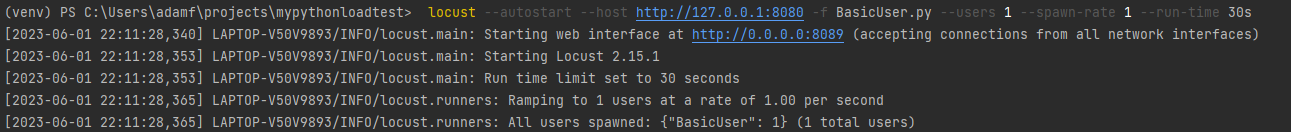
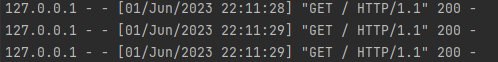
In this example, we configured our BasicUser to spawn 1 instance of itself (at a spawn rate of 1 per second), execute its task in a loop for 30 seconds, then terminate. The resultant load on our Flask application, as expected, was a bunch of GET traffic:
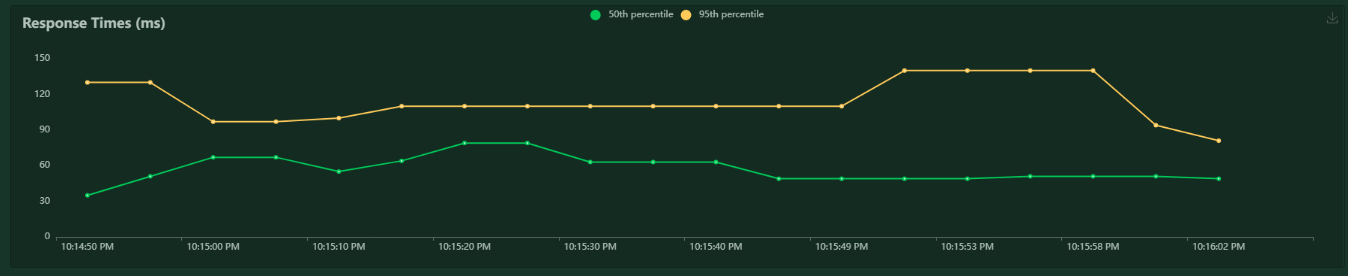
Arguably the best part about locust is the graphical interface that is built in, just from this simple test we can observe the load test results at http://localhost:8089/. For example, our response times (a.k.a client side latency) are sensible based on the server side latency of 10-100ms that we configured earlier:
Building Custom Load Profiles
We can create nearly arbitrarily complex load test scenarios by combining different user types and specifying custom load profiles. For example, the following load user will ramp up the load continuously by adding 10 users every 30 seconds.
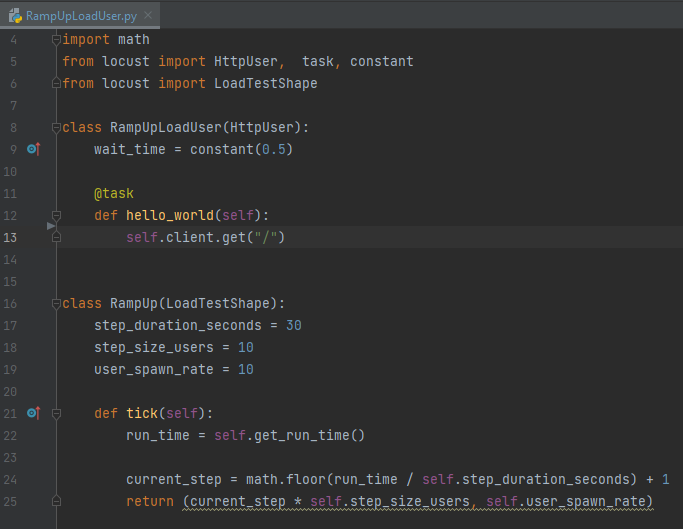
If we observe the requests per second of this load profile, it will be step up the load linearly until we terminate the load test.
We can also simulate non-trivial load patterns. Maybe you know that during your product launch, you system’s request volume will ramp up to some number, then normalize. We can simulate that via a sequence of load steps that begin at specific durations, like so:
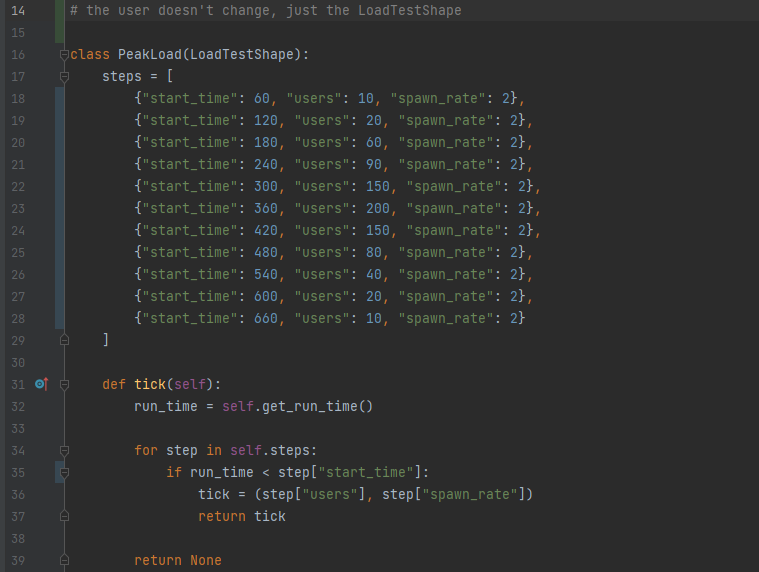
When we run this load profile, each load step will activate at “start_time”, and will last until the next load step is activated.
Lets see what happens when we run this profile on our application.
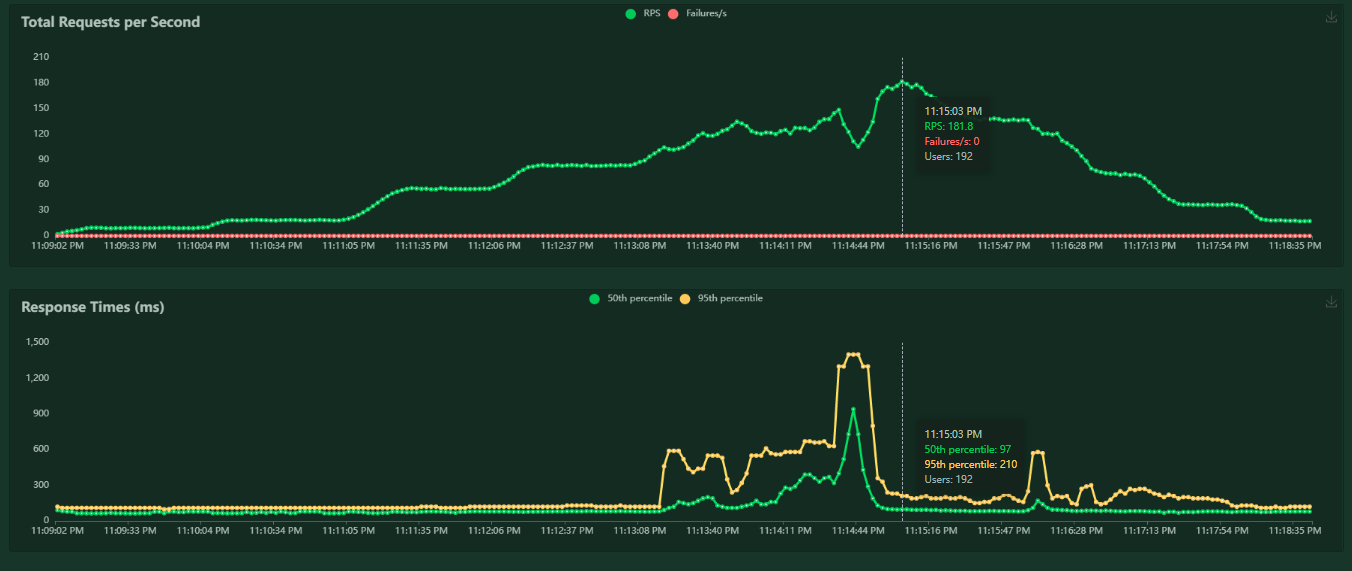
Not ideal. As our request rate increased, the server was not able to keep up and the request latency started increasing drastically. In a simple API like ours, high latency was the only symptom - but in a system with non-trivial complexity there are a swathe of failure modes that can occur if you start operating in this state.
So what’s next, do we throw our hands up and give up? Of course not…
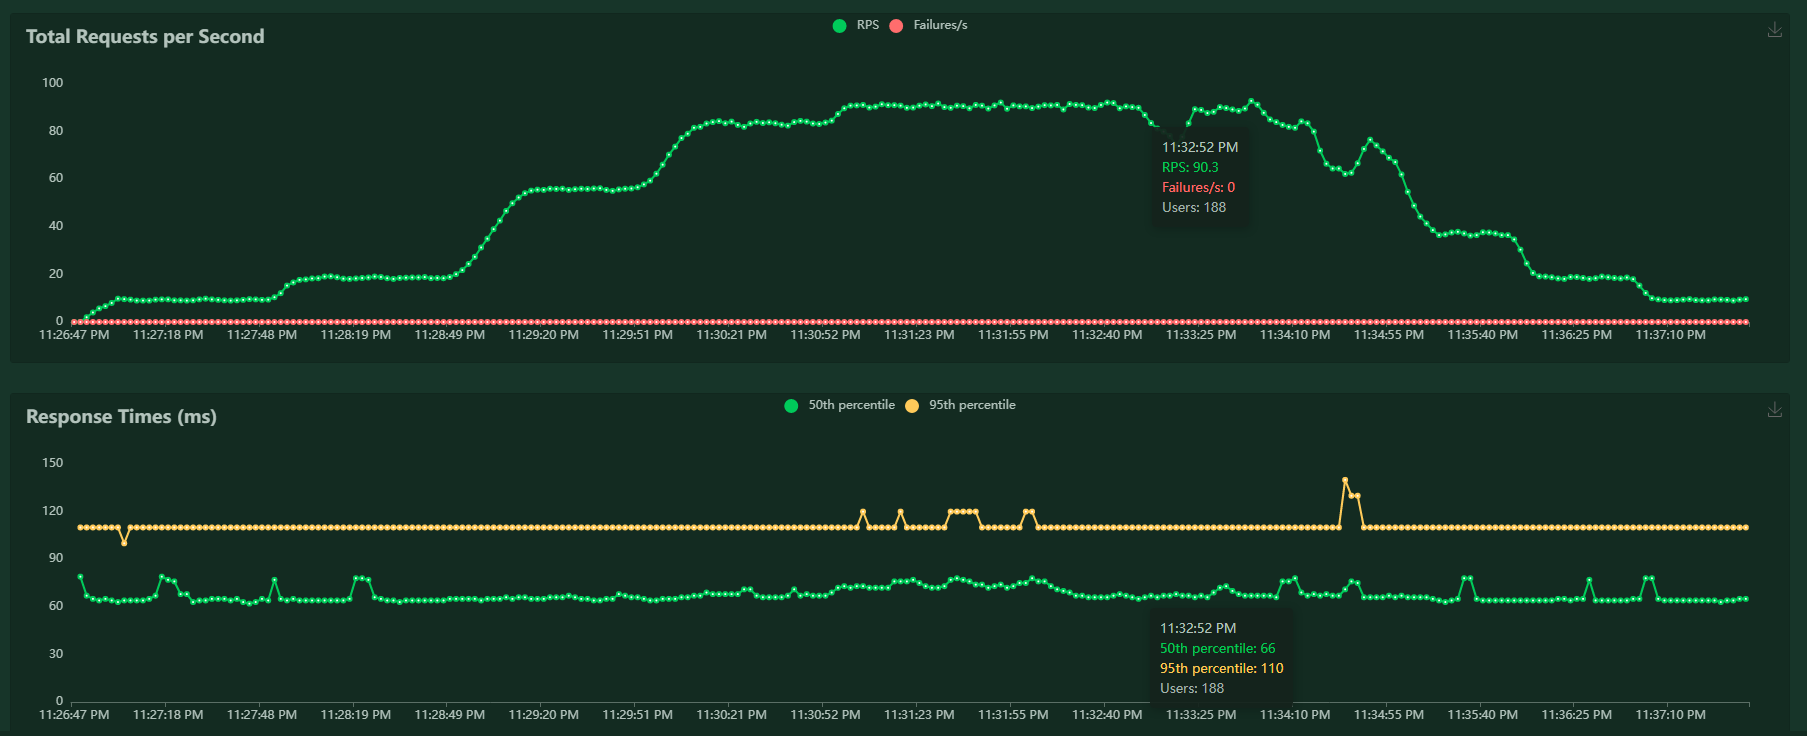
Hardening our API with a Production Web Server
Remember that warning Flask gave us about using a “debug” server? Well it’s time to heed that warning. Let’s see if we can improve our performance by using a web server that is more performant. We will use waitress-serve, but there are plenty of good options.

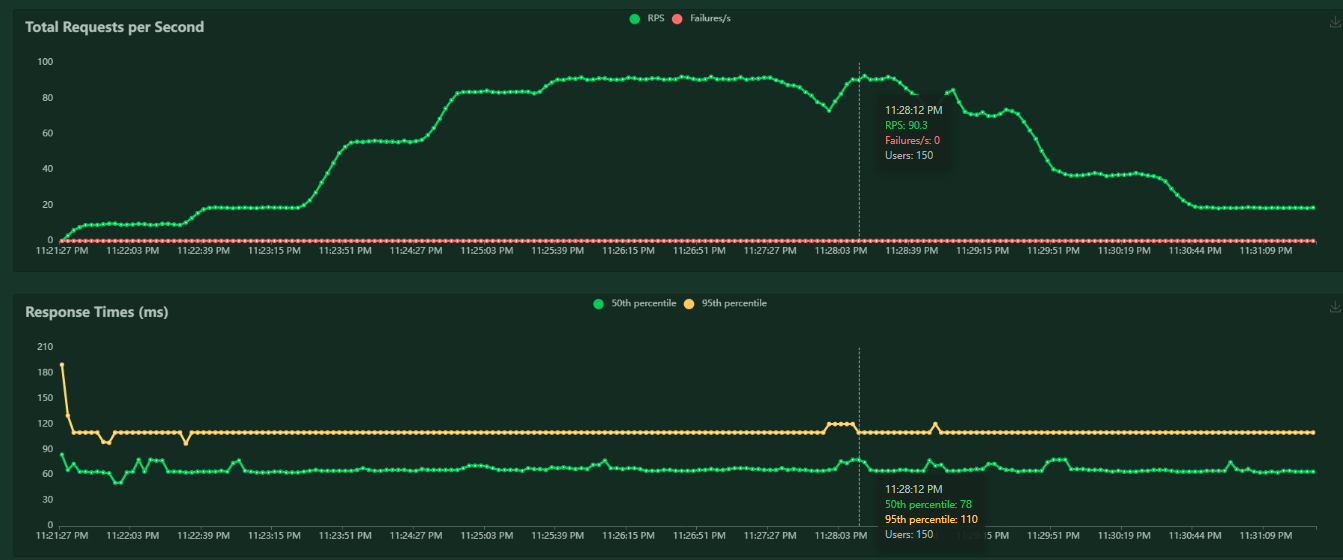
Now that’s a much more acceptable performance profile - our latency stayed steady throughout the test.
Next Steps
With some simple load tests of our locally hosted API, we have achieved a very powerful result - demonstrating how we can push a system to its limits, then make adjustments to it in order to sustain a load profile. That is exactly the kind of experimentation and tuning that is required to harden a real API.
We have only scratched the surface of how we can performance test our API, in future explorations, we will take a look at distributed load testing and deeper analysis of the golden signals (beyond just percentile and throughput).
Until then, happy load testing!
References
- https://sweetcode.io/api-load-testing-in-python-with-locust/
- https://www.digitalocean.com/community/tutorials/how-to-make-a-web-application-using-flask-in-python-3
- https://docs.locust.io/en/stable/custom-load-shape.html
- https://docs.locust.io/en/stable/writing-a-locustfile.html#wait-time-attribute
- https://thilani-mahaarachchi.medium.com/generating-custom-loads-with-locust-cffe72078f6b
- https://github.com/locustio/locust